Climate Action Plan
Background
On July 1, 2025, Redlands City Council voted to adopt the 2050 Climate Action Plan (CAP). This document is an update to the City’s first Climate Action Plan, which was adopted in 2017 in conjunction with the 2035 General Plan.
The updated CAP includes 58 unique measures that the City will initiate between now and 2050 to reduce emissions of greenhouse gases, thus helping to improve air quality as well as slow the progression of warming temperatures in the climate. In addition, the CAP is intended to expand community sustainability programs, support climate resilience and environmental equity, promote environmental education and outreach, set monitoring requirements to track project progress, and more.
Climate change affects everyone in the City of Redlands differently. The proposed solutions were written to address the need for versatility, while aiming to meet firm reduction targets. City staff are excited to share our comprehensive plan to address the growing need for climate action in our region.
Click here to read the Climate Action Plan.
Click here to view a flyer on the CAP.
Where our Emissions Come From
A key component of the CAP was determining GHG emission sources in Redlands. Staff conducted a GHG inventory to determine what was generating GHGs and quantify these emissions. See below for more details on the GHG inventory.
The study showed that GHG emissions were coming from the following sources:
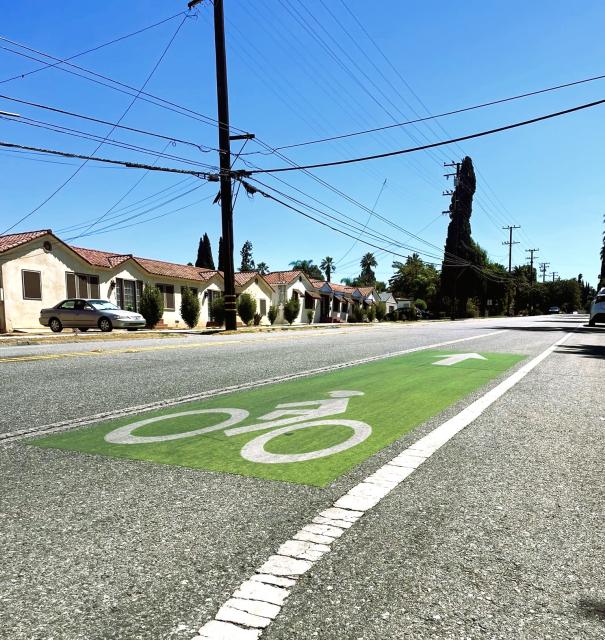
- Transportation
- Built Environment (i.e. electricity and natural gas use in our daily lives)
- Solid Waste
- Potable Water
- Wastewater
Therefore, our climate action plan was designed to address these sectors.
In addition to reducing emissions, we can also take steps to actively clean our air. This is done through Carbon Sequestration. Learn more about the important role that carbon plays here.
The measures defined in the CAP are organized by sector, including Carbon Sequestration.
GHG Inventory
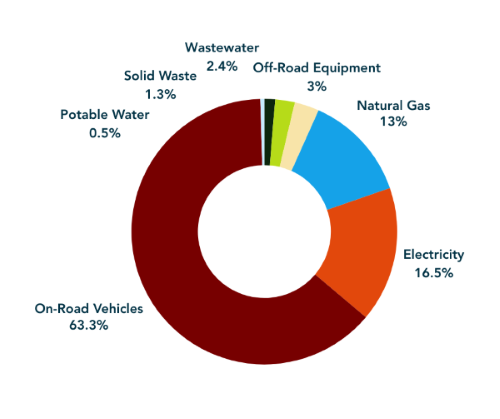
The GHG inventory quantifies our emissions in MTCO2e, or Metric Tons of Carbon Dioxide Equivalent. Since Carbon Dioxide isn’t the only GHG, we use MTCO2e as a unit of measure to determine warming potential. This helps standardize our measurements. *
As you can see from the graph above, the transportation sector generates two-thirds of the GHG emissions generated in our community.
This equates to 7.0 MTCO2e per capita per year. Our goal is to get this figure down to 1.0 MTCO2e per capita per year by 2050.
Here is a breakdown of total MTCO2e:
- 2022 Baseline – 554,413 MTCO2e
- 2030 Goal – 451,458 MTCO2e
- 2050 Goal – 82,228 MTCO2e
Reduction Needed – 314,284 MTCO2e
*For instance, Methane has 84 times the warming potential of Carbon Dioxide. Where Methane is generated, like the landfill, we can multiply 84 by the amount of methane that is quantified. This gives us the MTCO2e for methane from the landfill. Note that this is an extreme oversimplification. All inventories were calculated using up-to-date warming potential figures and were based on standard models used throughout the State of California.
Key Strategies
The City has determined key strategies to address these GHGs. As noted above, our actions are organized by sector.
Transportation:
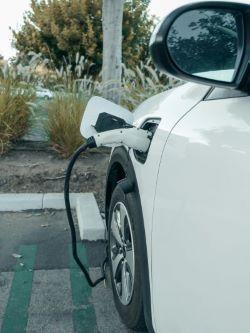
- Support the transition to EVs for residents and businesses
- Consider infrastructure changes to limit vehicle idling
- Work on commuting & public transportation programs with ANCA
Built Environment:
- Supporting policies to shape behaviors
- Educating the public on cost-effective energy efficiency upgrades
- Upgrade City infrastructure and equipment
Solid Waste:
- Achieve a diversion rate of 75%
- Promote edible food recovery
- Expand education on resource recovery and circular economies
- Use policy changes as a tool to reduce waste
- Work with community organizations on single-use plastic programs
Potable Water & Wastewater:
- Expand current water conservation programs
- Promote drought tolerant landscaping
- Increase enforcement of water use restrictions
- Increasing efficiency of plant operations
Carbon Sequestration:
- Plant trees throughout the city to provide shade, clean air, water retention, and more.
Sustainability Outside of the CAP
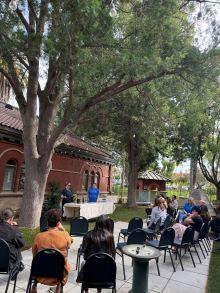
Redlands has sustainability goals outside of the actions listed in the CAP. Expanding environmental education and outreach to the community and developing key partnerships is necessary to create a more sustainable culture in Redlands and successfully implement the CAP. These initiatives include:
- Expanding & starting community programs
- Connecting with local organizations
- Supporting Redlands Earth Day
- Engaging staff in sustainable practices
- Promoting environmental education & action